Do you use free tools for your data analysis projects?
Whether you choose free or paid tools, they should accomplish one major purpose.
Tools should help you to do more.
Are you are spending more time figuring out how to use a tool? Or do you end up doing more work, since it’s not as efficient as the tool promised?
You may have to rethink your strategy.
I believe that tools should be easy to use and provide a good impact.
That being said, you will need to try out and replace your tools every once in a while.
And over time, you will be left with a handful of reliable tools to analyze to your data.
Here’s a list of the 10 free tools that I have continued to use over the years, in many of my data analysis projects.
Important: Although tools are necessary, having the skill is the first step to becoming a data analyst. These tools can only enhance, but not replace your skills.
RELATED: Top Skills You Need as a Data Analyst
1. Google Drive (and Backup and Sync)
EXTERNAL LINK: https://drive.google.com/
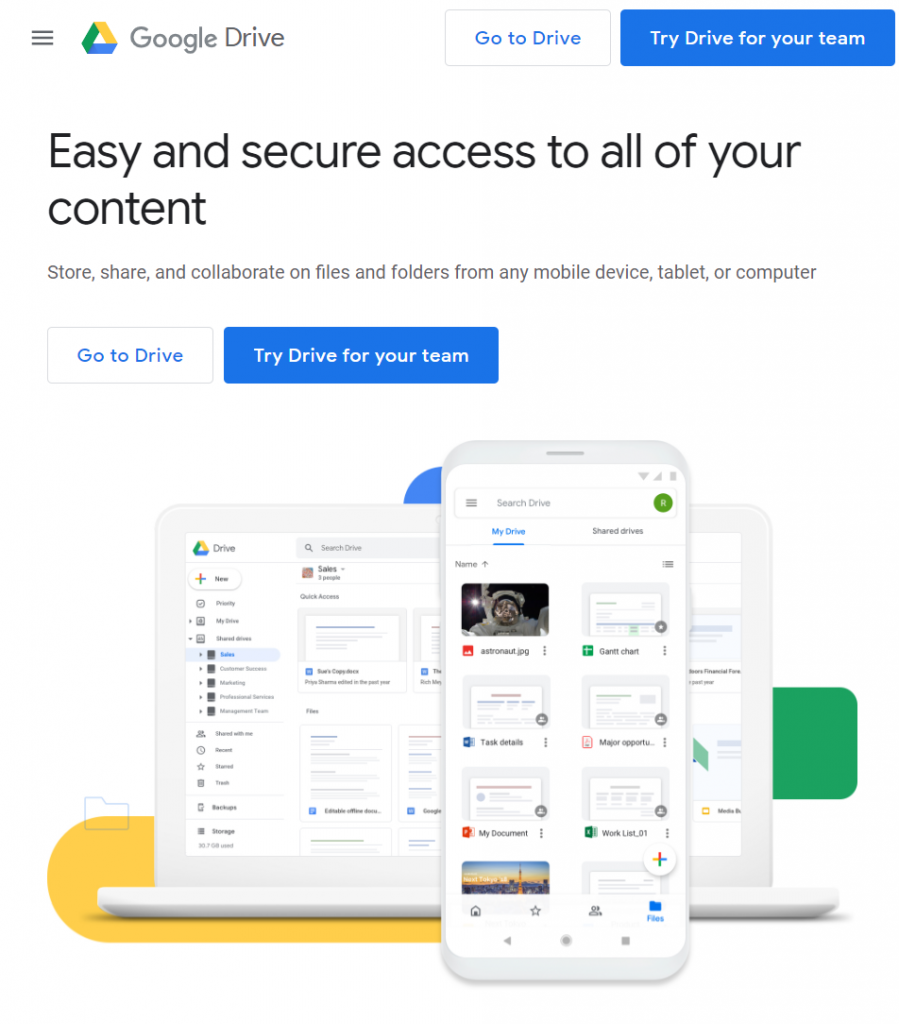
This is a massive productivity boost for you. Consider getting this as early as you can.
Google Drive is an application that allows you to store files online. We also call this cloud storage.
You will need a Google account (or Gmail email account) to get access to the platform.
The first 15 GB of cloud storage is free.
Access your files anywhere. Google Drive works across many platforms, including your browser, iOS or Android phones, and your computer.
This means that even if you’re outside, Google Drive allows you to access your files through your mobile phone.
Backup and Sync from Google is the name of software that you install on Windows and Mac computers. It’s basically Google Drive for computers.
Collaborate with teams on shared files. With Google Drive, you can also share files to your client, and vice versa.
When you make an update on any files, everyone’s copy gets updated – as long as they’re online.
You also see the history of changes that were made on a file. This make it easy to track all changes within the project.
Tip: Organize your files so it’s easy to find what you need for each client or project. I usually keep all work-related files into a single folder.
Requirements: Google/Gmail Account
Data Analyst Skill: Automation and Process Improvement
2. Notepad++
EXTERNAL LINK: https://notepad-plus-plus.org/downloads/
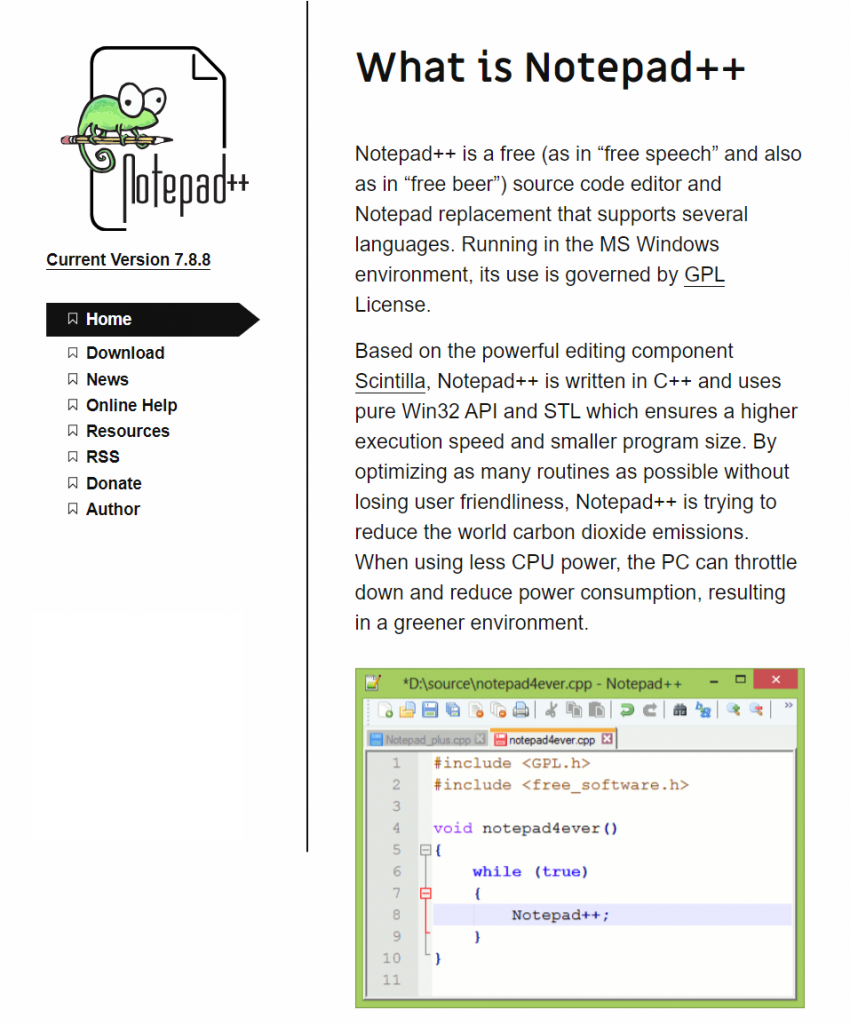
Pronounced as Notepad Plus-Plus, this is my favorite tool to edit and manipulate text files.
Their best feature is their frog icon.

Their next best feature is their color-coded text editor.
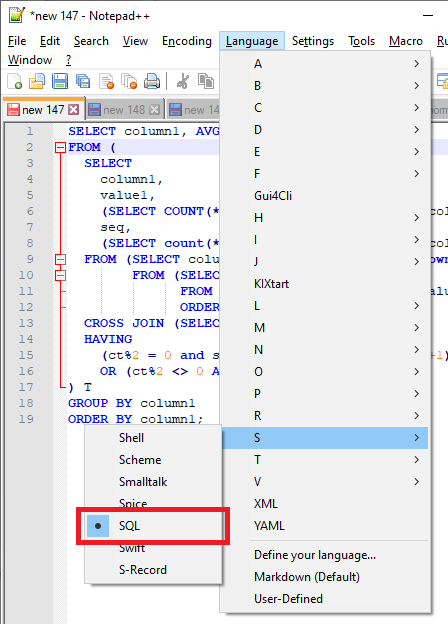
I know that many of the errors are caused by a missing comma or parenthesis. Turning on the color-coded text for SQL helps me to see these errors.
In the menu, click on Language, and you’ll see a list of languages. I often use this for SQL.
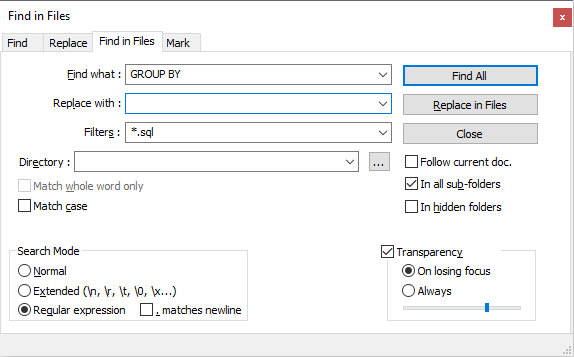
Notepad++ Advanced Search: search for words, word patterns, or regular expressions in a in multiple files or folders.
With Notepad++, you can make laser-focused searches. Find the keyword “GROUP BY” that was only used in a SQL file (*.sql).
This is how the Notepad Search looks like:
This is the ultimate time saver.
I can look at my old programs, R scripts, or SQL queries.
Instead of developing code from scratch, I have a working code to start with.
I can also replace text intelligently, since regular expressions and match groups are supported in Notepad++.
All of these in a text editor with a cool logo!
Requirements: Install the Software
Data Analyst Skill: Automation and Process Improvement
3. Grammarly
EXTERNAL LINK: https://www.grammarly.com/

Communication is a skill that you also need to master as a data analyst.
Always remember that even authors need reviewers for their books or scientific journals before these are released.
As a data analyst, you should make it a habit to review your emails and all written content before you deliver them.
Grammarly makes sure that your words are correctly spelled, you have the correct punctuation marks, and that you are writing naturally.
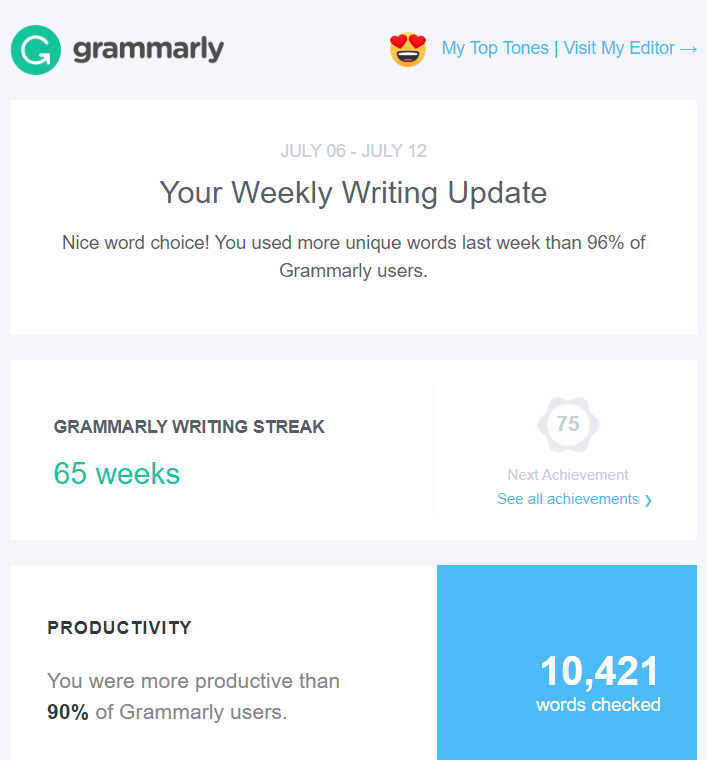
While they have a paid version, I’ve been using the free version for over a year now – a whopping 65 weeks at this time!
Grammarly Insights delivered weekly. They send weekly updates to your email to summarize your weekly performance.
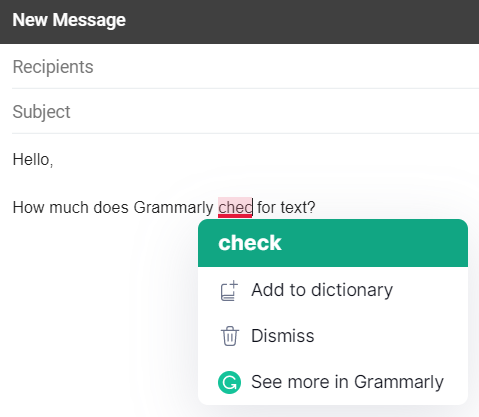
Real-time checking. As you compose your email, the Grammarly Chrome extension will scan your sentences, notify you when you have errors, and make recommendations.
Grammarly can also be integrated with your Google Docs.
Requirements: Install as a Google Chrome extension
Data Analyst Skill: Communication
4. Baretail
EXTERNAL LINK: http://www.baremetalsoft.com/baretail/index.php
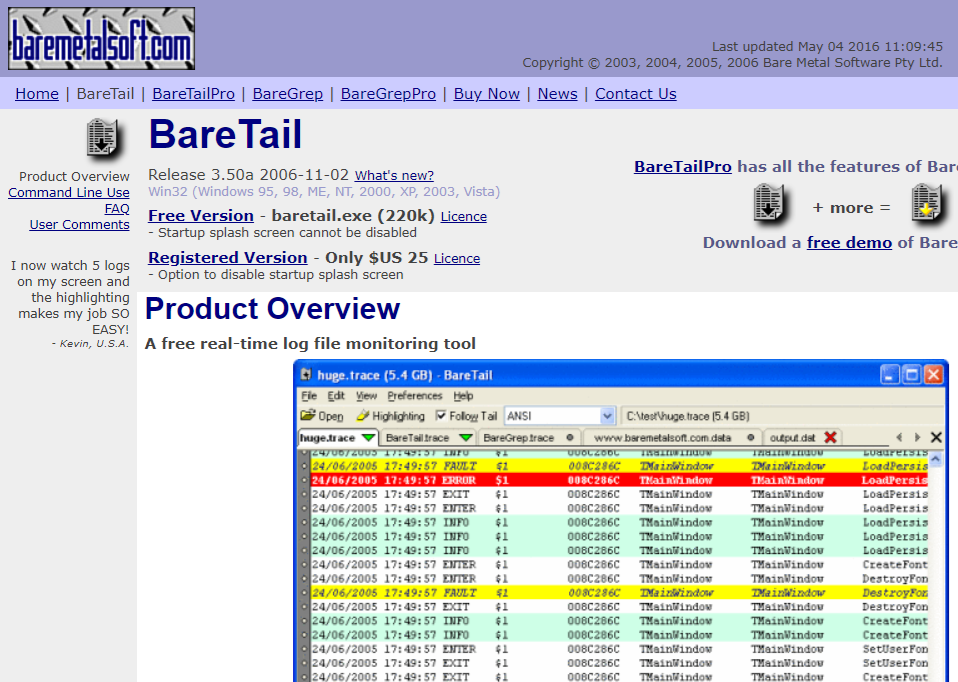
This software is OLD.
I used this tool for the first time in 2014, and it hasn’t changed much since then.
But for me, this tool has been fantastic with one job, even in 2020.
Baretail can “peek” through a very large file without having to read all of it.
Top-speed, crash-free performance. And while most programs like Microsoft Excel, or even Notepad++ can crash while opening a file, this is as lightweight as it can get for inspecting files.
Originally meant to read server logs that grow 24/7, I use Baretail for many of my data inspection and cleaning tasks.
What’s the first thing that you do when you receive a file containing data?
Similar to getting a delivery, do you immediately start working on your analysis?
No, right?
For your packages at home, you check for missing items, if the color is correct, and if the number of items is correct.
For data, if you’re looking at a CSV file, you want to check if it’s really using commas.
Sometimes, tabs are used, and other times, there are missing columns.
How about a file where you are expecting a header, but is missing one?
Inspect your data. With Baretail, you see if a data extract has a header column, identify the delimiter used, and get the general structure of a file.
When Excel or Notepad++ fails for huge files, Baretail has you covered.
Requirements: No installation needed, just run baretail.exe
Data Analyst Skill: Automation and Process Improvement
5. Winmerge
EXTERNAL LINK: https://winmerge.org/downloads/?lang=en
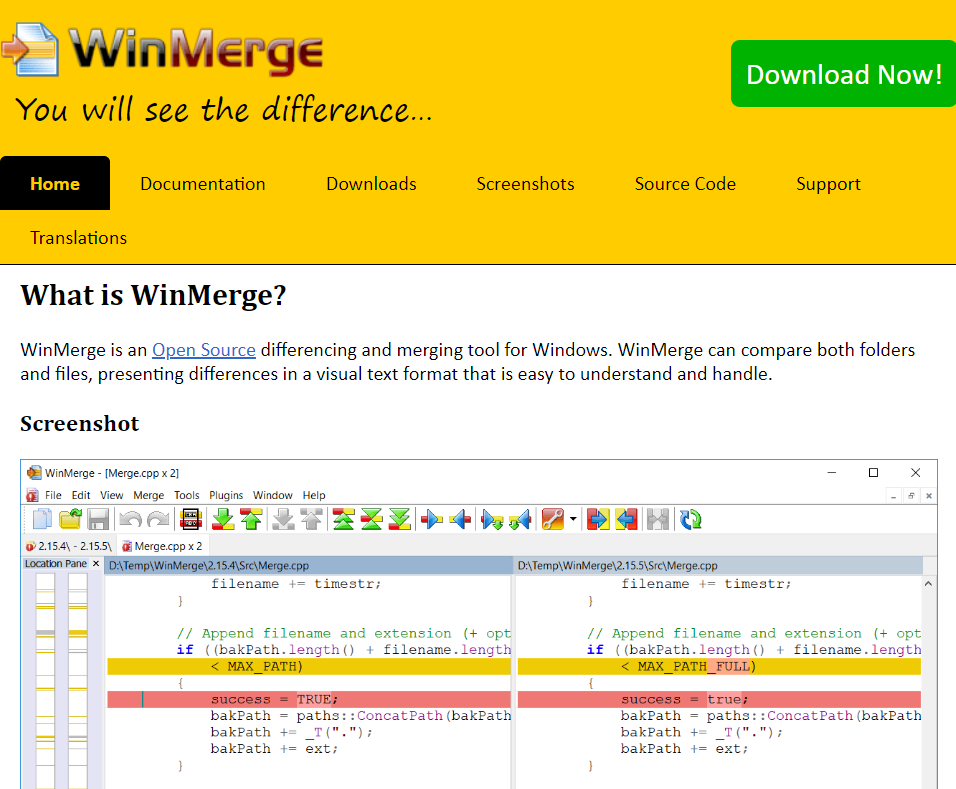
This is another old software, along with Baretail.
Winmerge is a tool that checks for differences between two files.
Imagine sending a file over to the data engineering team, only to find out that you sent an incorrect file with no changes at all.
Or worse, a file with the incorrect changes!
I use Winmerge to compare a revised query from the original one.
I also use this tool to check for the changes to an updated data extract (if the file is small).
Compare two files in two clicks. Winmerge can be integrated with your right-click menu. Just select two files, right-click, and click Winmerge.
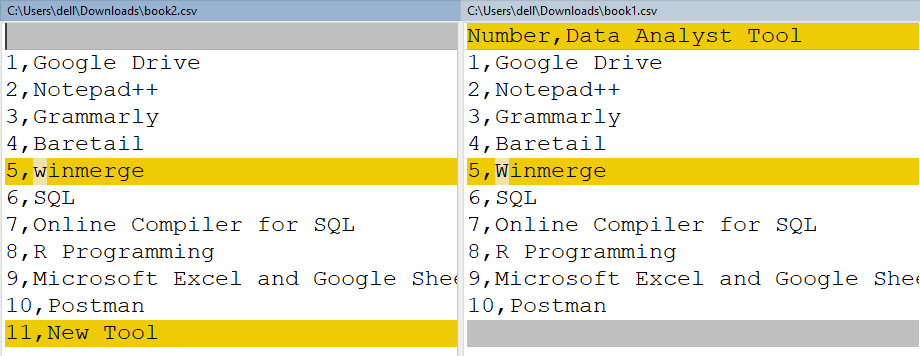
In this example, Winmerge can identify if a line was deleted, a new line was added, or a line has a conflict.
The tool can identify winmerge vs Winmerge, where the capitalization was changed.
The downside is that this platform only works on Windows.
For Mac users, I have read about alternatives, such as FileMerge and DiffMerge. However, I cannot vouch for them.
Requirements: Install the Software, Windows only
Data Analyst Skill: Automation and Process Improvement
6. Pomodoro
EXTERNAL LINK: https://tomato-timer.com/
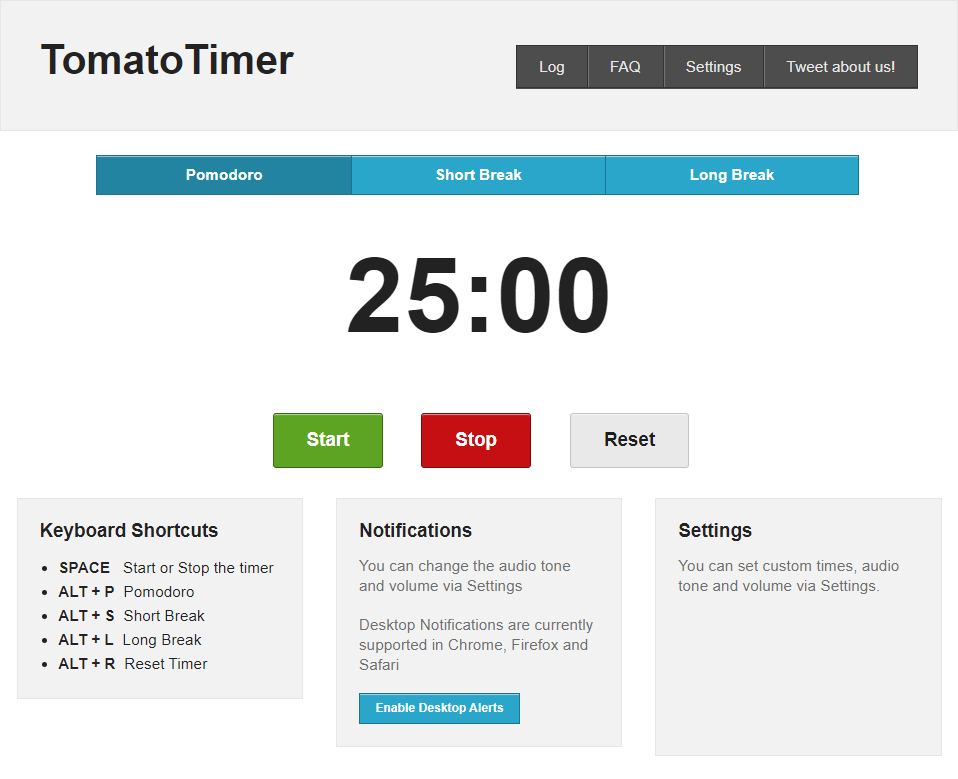
I only have two productivity hacks that I constantly use until today: it’s bullet journaling and the pomodoro technique.
Pomodoro is Italian for tomatoes. How does this relate to the technique, you ask?
Have you seen kitchen timers in the shape of a tomato?
This is where the concept of the pomodoro technique came from.
Productivity is best achieved if you measure it in time.
In this strategy, if you need to do a large project for many hours or days, you need to divide it into 25-minute work intervals, followed by 5-minute rests.
For example, if you plan to work from 8 am to 9 am, this is your schedule:
- 8:00 am – 8:25 am – Pomodoro (or work)
- 8:25 am – 8:30 am – Rest
- 8:30 am – 8:55 am – Pomodoro
- 8:55 am – 9:00 am – Rest
Whatever you finish within 25 minutes, that’s your output.
You do not base your accomplishments on results, but only with time.
This combats one of the biggest enemies of productivity, which is procrastination.
During your 25-minute work intervals, you cannot go to the pantry to make coffee, or respond your emails, or look at your phone.
This technique allows me to do so much work in 2 hours.
There are many free Pomodoro tools out there, but I recommend Tomato Timer. The alarm is not too loud, and you can access it on your browser.
Requirements: Access the website
Data Analyst Skill: Productivity
7. Online Compiler for SQL
EXTERNAL LINK: https://rextester.com/l/sql_server_online_compiler
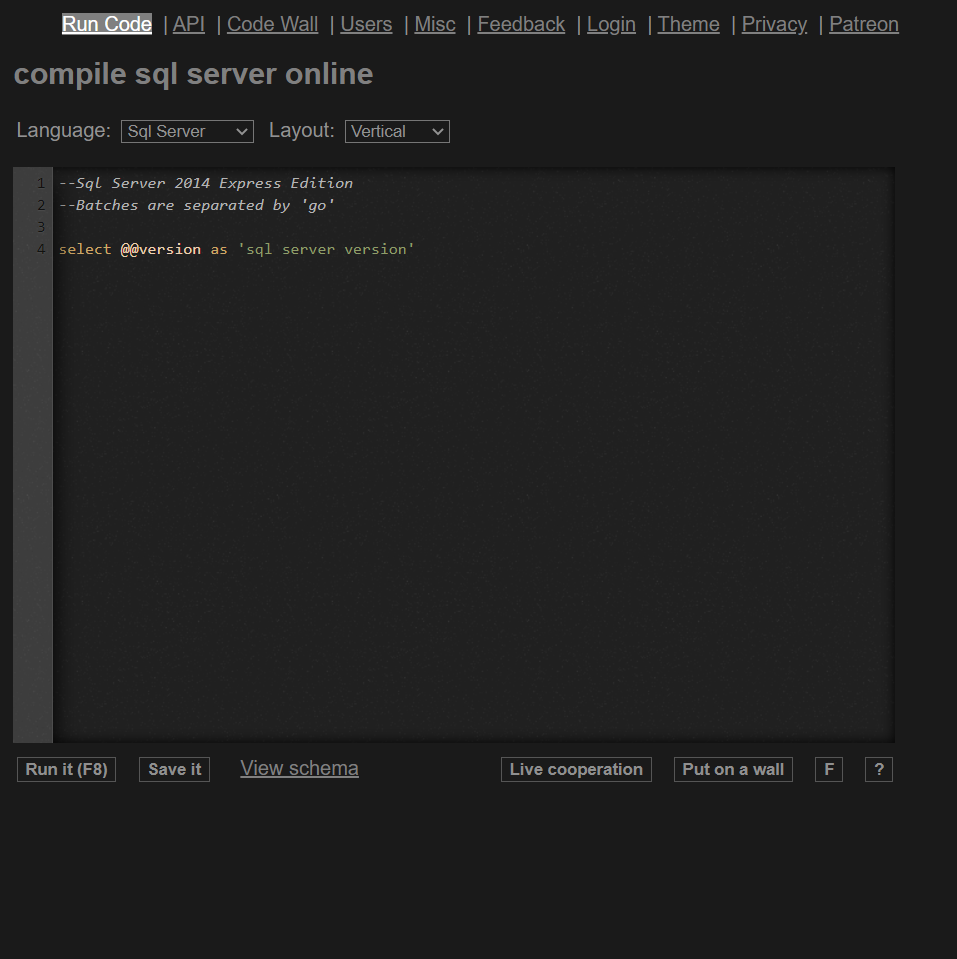
An online compiler for SQL is a database that you access through your browser.
Wow, just online?
Will this replace your installed databases?
In most cases, the answer is NO.
You can use an online compiler to make quick tests.
However, working on your actual data will need to be done in your database.
Test out different functions and databases quickly. An online SQL compiler allows you to test out functions and their expected output.
For example, what does the STRPOS function do in MySQL? In cases like these, an online compiler is your best friend.
Additionally, some SQL keywords and functions are specific to a database.
You can use these online compilers to see the results, without installing a new database.
I use Rextester, and it supports Oracle, MySQL (below 8.0), Microsoft SQL Server, and PostgreSQL.
EXTERNAL LINK: Rextester for Oracle | MySQL |Microsoft SQL Server |PostgreSQL
What are the downsides of an online compiler?
First, you cannot insert custom data.
Most of the time, to create data, you need to use subqueries with the UNION ALL keyword. If a CTE or WITH clause is supported, you can also use that.
Second, some later versions, such as the powerful MySQL 8.0, are not (yet) supported.
This means that you cannot run analytical functions like RANK, DENSE_RANK, and ROW_NUMBER. MySQL also started supporting CTE from MySQL 8.0 or higher, so you can’t use that as well.
Third, there can be downtime.
You have no control if a website is going to perform maintenance. If you suddenly went offline, you won’t be able to access the compiler.
Despite all these, online compilers are still a good supplement to your database.
It’s free, it’s fast, and there’s flexibility to it!
Requirements: Access the website
Data Analyst Skill: Programming for Data
8. R Programming
EXTERNAL LINK: https://cran.r-project.org/mirrors.html
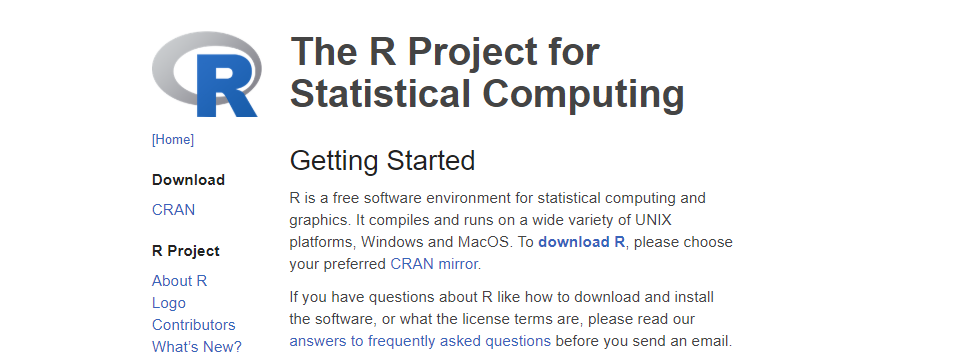
Hands down – R is one of your best free tools when it comes to data analysis.
I definitely recommend R as a programming language.
Most of your Mathematics and Statistics techniques are available here.
You can process data, apply linear and non-linear optimization, and perform predictive analytics.
As a free statistical tool, R has an active community. You can see people in the community like Hadley Wickham continuously develop libraries and methods in R.
For data processing, you can depend on the tidyverse package.
For stunning charts, use the ggplot2 package.
You can also create dashboards in R using R Shiny.
Tip: R uses memory to process data, so you might consider getting an 8GB or 16GB RAM at least. This will ensure a smooth experience.
This tool is available in Windows, Mac, and Linux.
Requirements: Install the Software, available in Windows, Mac, or Linux
Data Analyst Skill: Programming for Data
9. Microsoft Excel and Google Sheets
EXTERNAL LINK: https://www.office.com/ (Microsoft Excel Online)
EXTERNAL LINK: http://sheets.google.com/ (Google Sheets)

A spreadsheet program like Microsoft Excel or Google Sheets can cover most of your day-to-day tasks.
Data Processing. You can clean your data, filter empty results, and summarize them into pivot tables.
Tip: Press Ctrl + Shift + L (in Windows) or Command + Shift + F (in Mac) to enable the Filter feature.
With this feature enabled, you can see the list of values for a column. This is extremely helpful for cleaning and checking the quality of data.
This is a sample Excel sheet, where the Gender column (Column B) seems to have values M and F only.
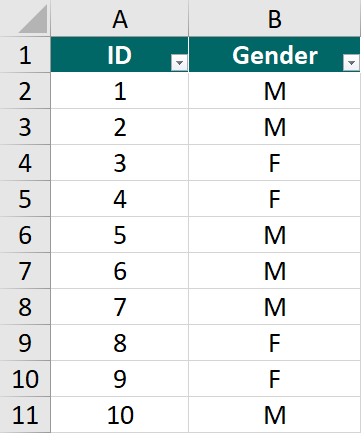
What if you have 100,000 rows – how can check if this is still the case?
This is where the Filter feature comes in handy.
If we inspect this column in the Excel filter function, we will see that there are other values in our data.
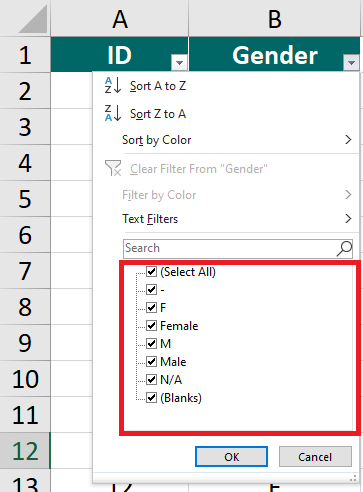
There are rows with a hyphen (-), and the actual words Male and Female. We also have N/A and blank rows.
This is going to be your responsibility as a data analyst.
Sometimes, the IT department will tell you that the data is correctly extracted. However, inconsistencies can happen, and you need to do your own checking.
You are the data expert, after all!
Requirements: Access the website for the free version
Data Analyst Skill: Programming for Data
10. Postman
EXTERNAL LINK: https://www.postman.com/downloads/

If you’re in the Digital Marketing, SEO, or Automation industry, you may have encountered API, or API endpoints.
These API endpoints are lines that look exactly like URLs.
However, when you access the URL, instead of getting a website, you are getting data. This data is usually in JSON format.
Let’s look at an example of an API endpoint from YouTube that we can use to get data – the YouTube Data API v3.
YouTube API Analytics
I automate the extraction of YouTube data for competitor analysis.
Using the YouTube API, you can automatically get the list of videos that a public channel has uploaded. You can also see other video information like:
- Subscriber Count (if exposed)
- Video View Count
- Likes and Dislikes
Postman App
This is what the Postman App looks like.
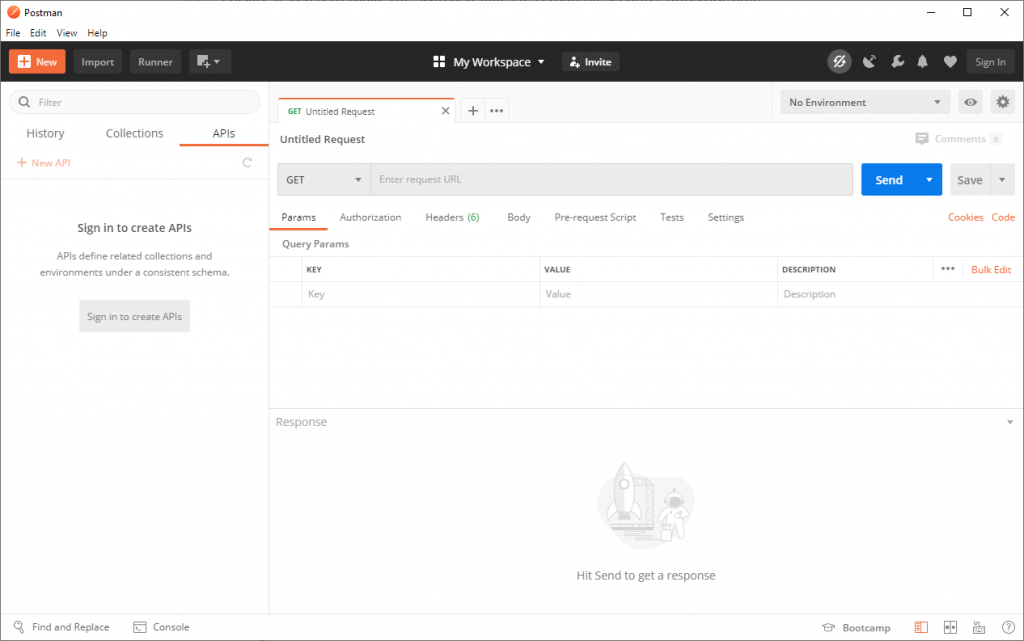
Advanced API exploration. You canuse Postman to verify if an API endpoint is working. You can also send API requests with additional information such as parameters and keys (that act like passwords).
Requirements: Install the Software
Data Analyst Skill: Programming for Data
Free vs Paid Tools for Data Analysis – What’s the Difference?
There’s a lot of free tools that you can use online for data analysis.
Now, the big question –
Should you choose Free over Paid tools?
My answer is no.
For example, the Microsoft Excel free version can only be accessed online. You need to purchase a license to have offline access.
Another example: Compared to Postman, paid tools such as Supermetrics can greatly improve productivity, and you can integrate directly with your reports and spreadsheets.
Many free tools are free, and you should definitely use them, if it serves purpose.
However, premium tools can come at a price but often have better features.
They also have customer support because they have the finances to operate the business.
Use free tools until you can justify the cost of a paid tool. If you have a project, of if you need to improve your services, it’s usually a good time to pay for a tool.
With bigger projects, the requirements are usually more complex, and free tools will not be enough.
In these cases, clients are willing to pay for the paid tools.
If you keep on using free tools, you will not get the experience and leverage needed to land bigger projects.
Most importantly, this is not a black and white situation.
Free and paid tools should complement each other.
Conclusion
Did you find a tool here that interests you?
These are tools that I have personally been using for years. Drop a comment below if you have any questions on how to use them!
